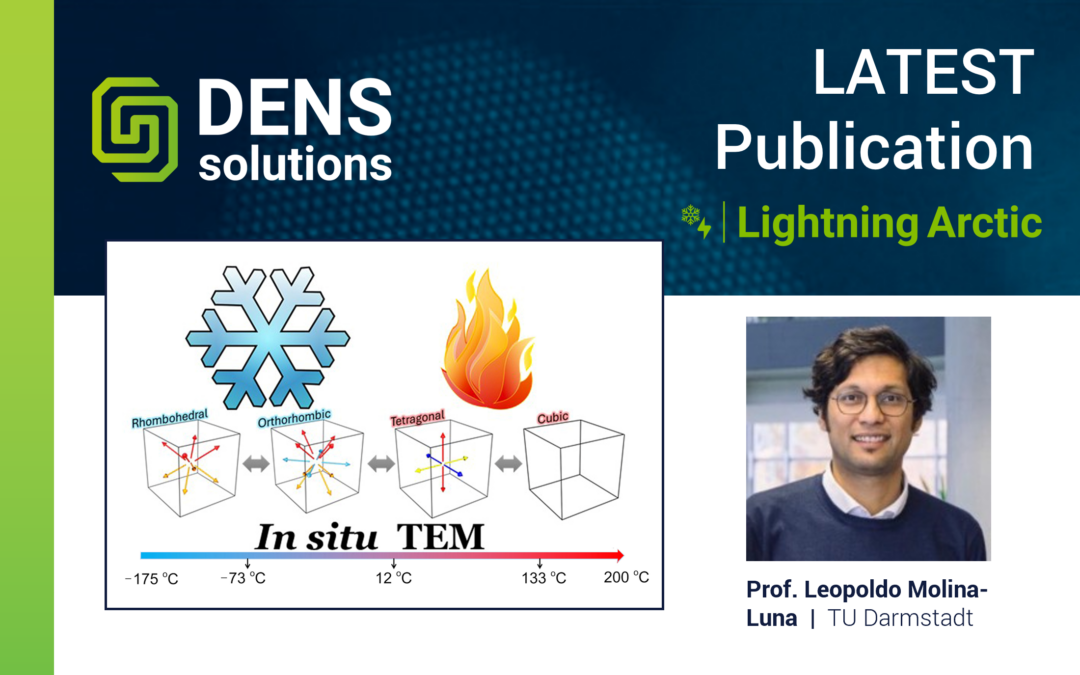
In situ TEM cooling meets high-precision heating: Exploring BaTiO₃ phase transitions with Lightning Arctic

In situ TEM cooling meets high-precision heating: Exploring BaTiO₃ phase transitions with Lightning Arctic

Using the DENSsolutions Lightning Arctic system, researchers uncover the temperature-driven phase transitions and domain wall dynamics in single-crystal BaTiO₃ with atomic precision across cryogenic and elevated conditions.

Original article by Jiang et al.
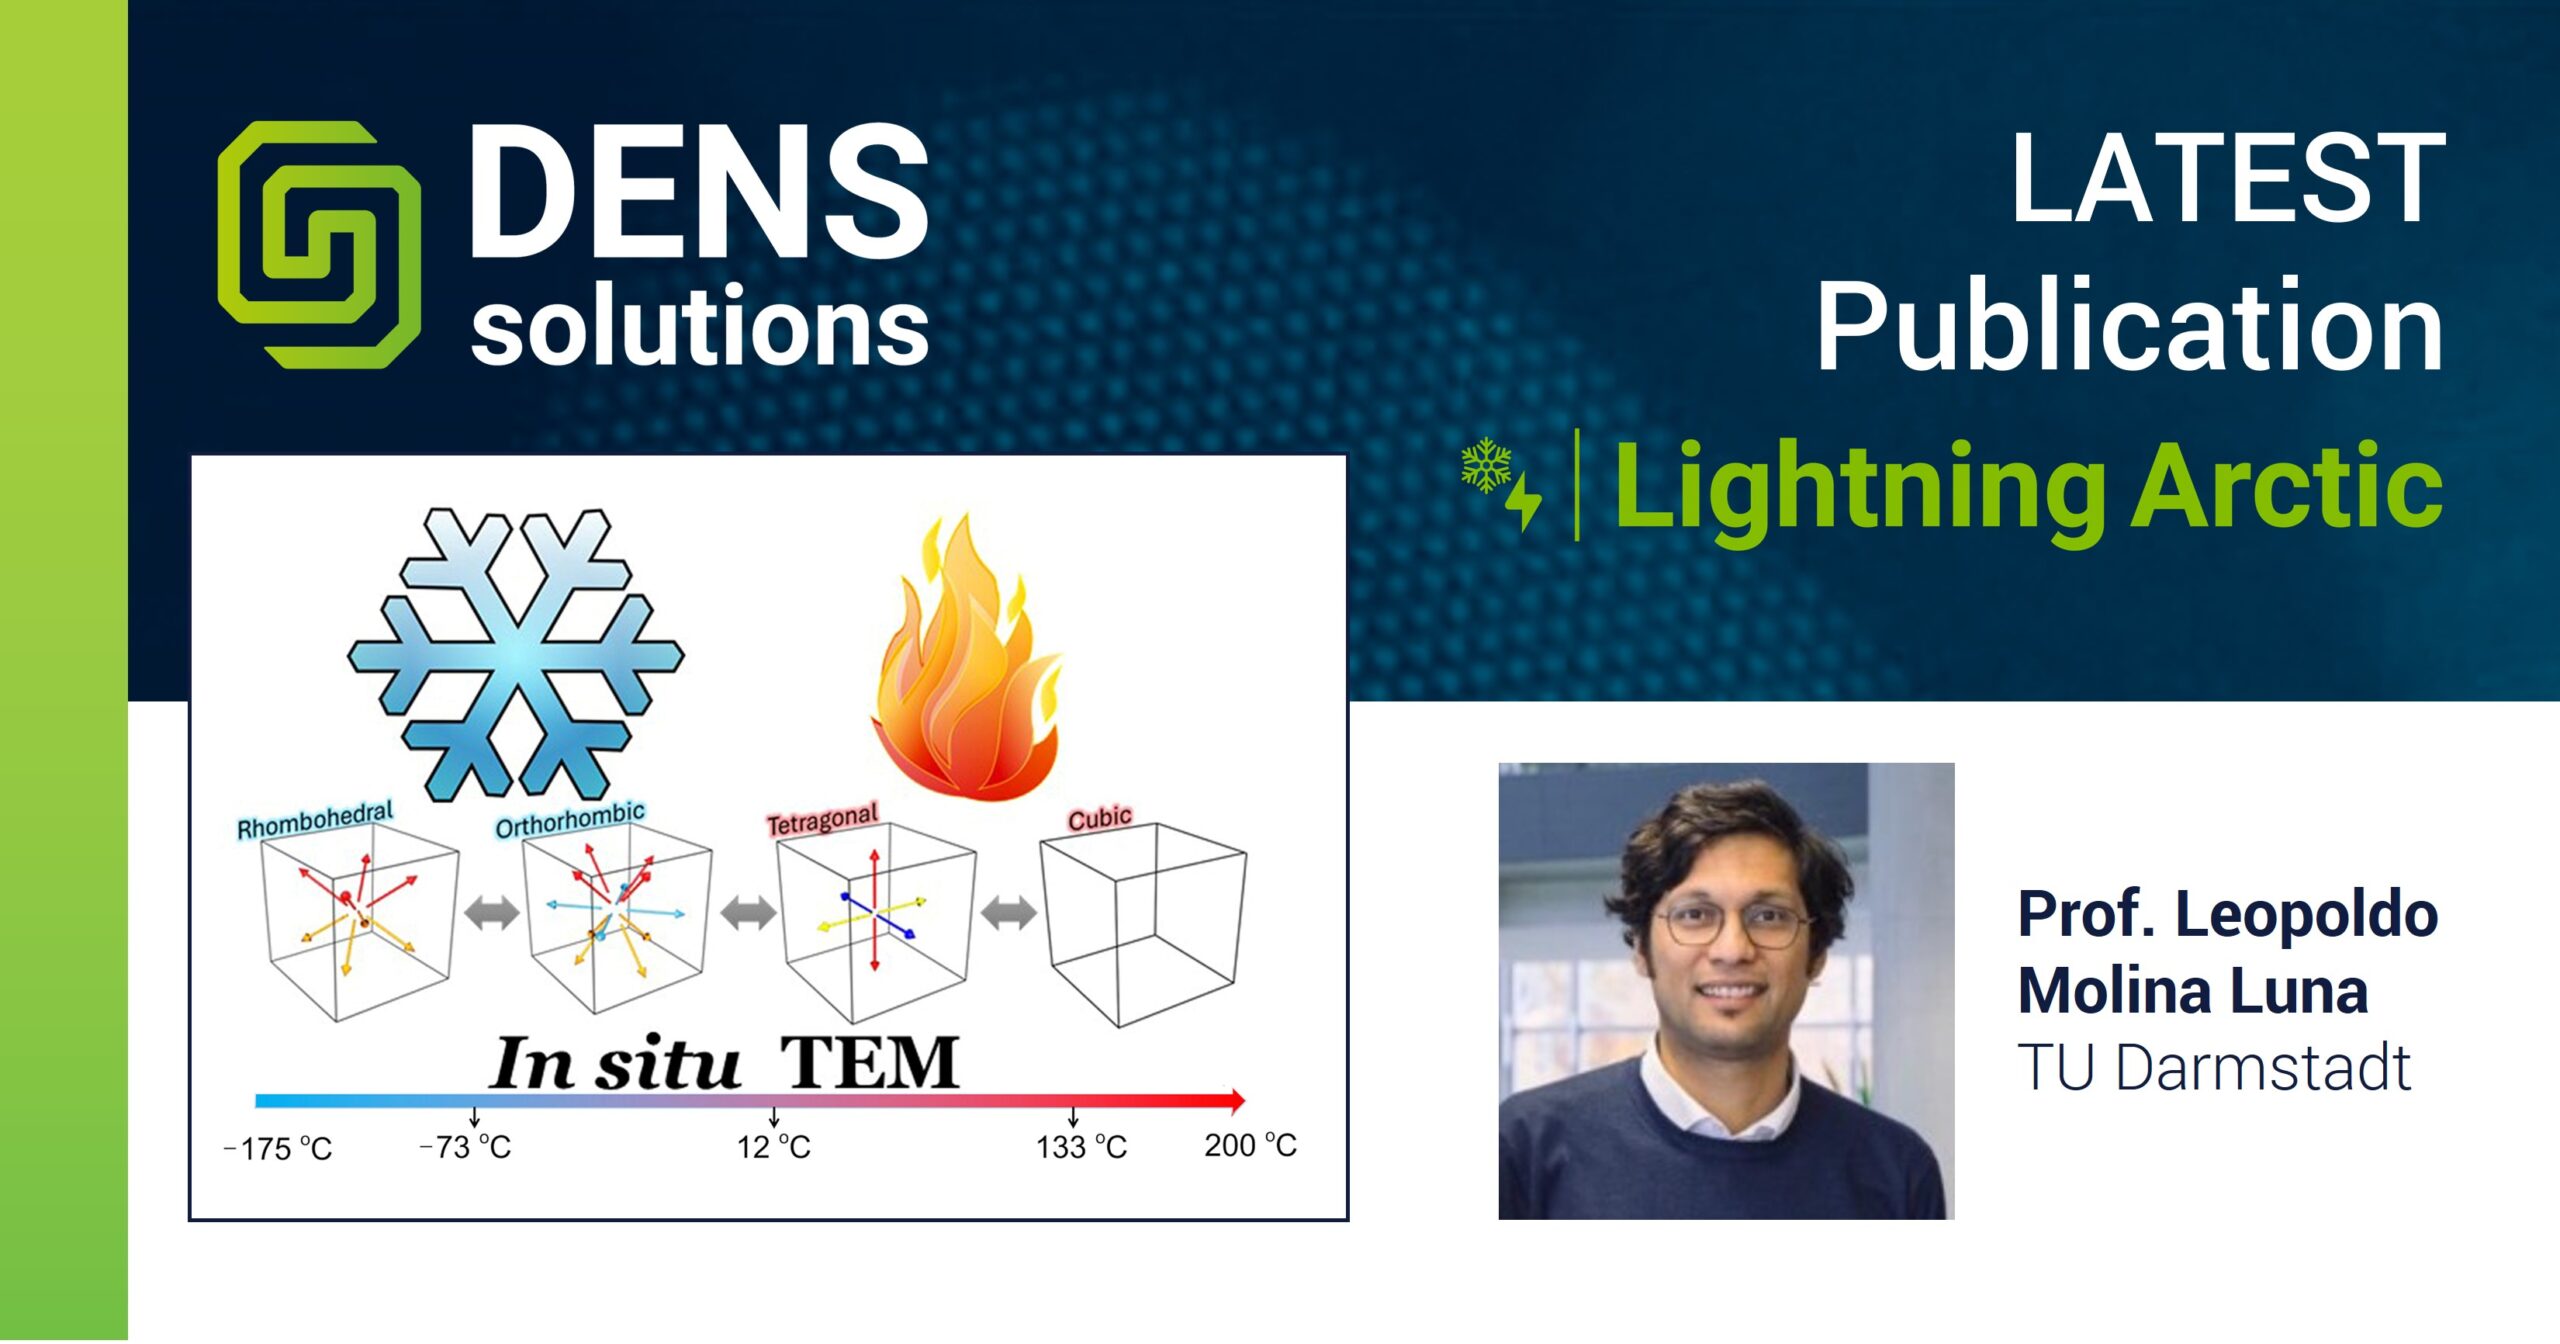
Understanding the intricate phase transitions and domain dynamics of ferroelectric materials like barium titanate (BaTiO₃) is essential for improving their functional properties in applications such as capacitors, sensors and actuators. However, achieving atomic-resolution insights across a wide temperature range—spanning cryogenic to elevated conditions—remains a significant challenge. In a recent study published in Microstructures, Prof. Leopoldo Molina-Luna’s group at TU Darmstadt utilized our Lightning Arctic system to investigate the phase transitions and domain evolution of single-crystal BaTiO₃. By utilizing the system’s cryogenic cooling and heating capabilities, the team achieved unparalleled stability and resolution, enabling direct observations of phase behavior and domain wall dynamics from -175 °C all the way to 200 °C.

Lightning Arctic: Ultra-high stability

The DENSsolutions Lightning Arctic solution was used in this study for the application of in situ TEM cooling and heating. The cooling capability of Lightning Arctic is enabled via a cooling rod inside the holder, which transfers the ‘cold’ towards the holder’s tip where the MEMS-based Nano-Chip holding the sample is located. Once this cooling rod is connected to a metal cooling braid that is immersed in a liquid nitrogen dewar, the sample can be cooled inside the TEM to liquid nitrogen temperatures.

Impressively, the researchers were able to achieve atomic-resolution imaging at cryo-temperatures with notably low sample drift. This is due to the ultra-high stability of the holder. They captured a sequential of ten frames of HAADF STEM images on a single-crystal BTO TEM sample. The first frame, provided below in Figure 1a, evinces the exceptional stability of the holder, enabling atomic-resolution imaging at -175 °C.
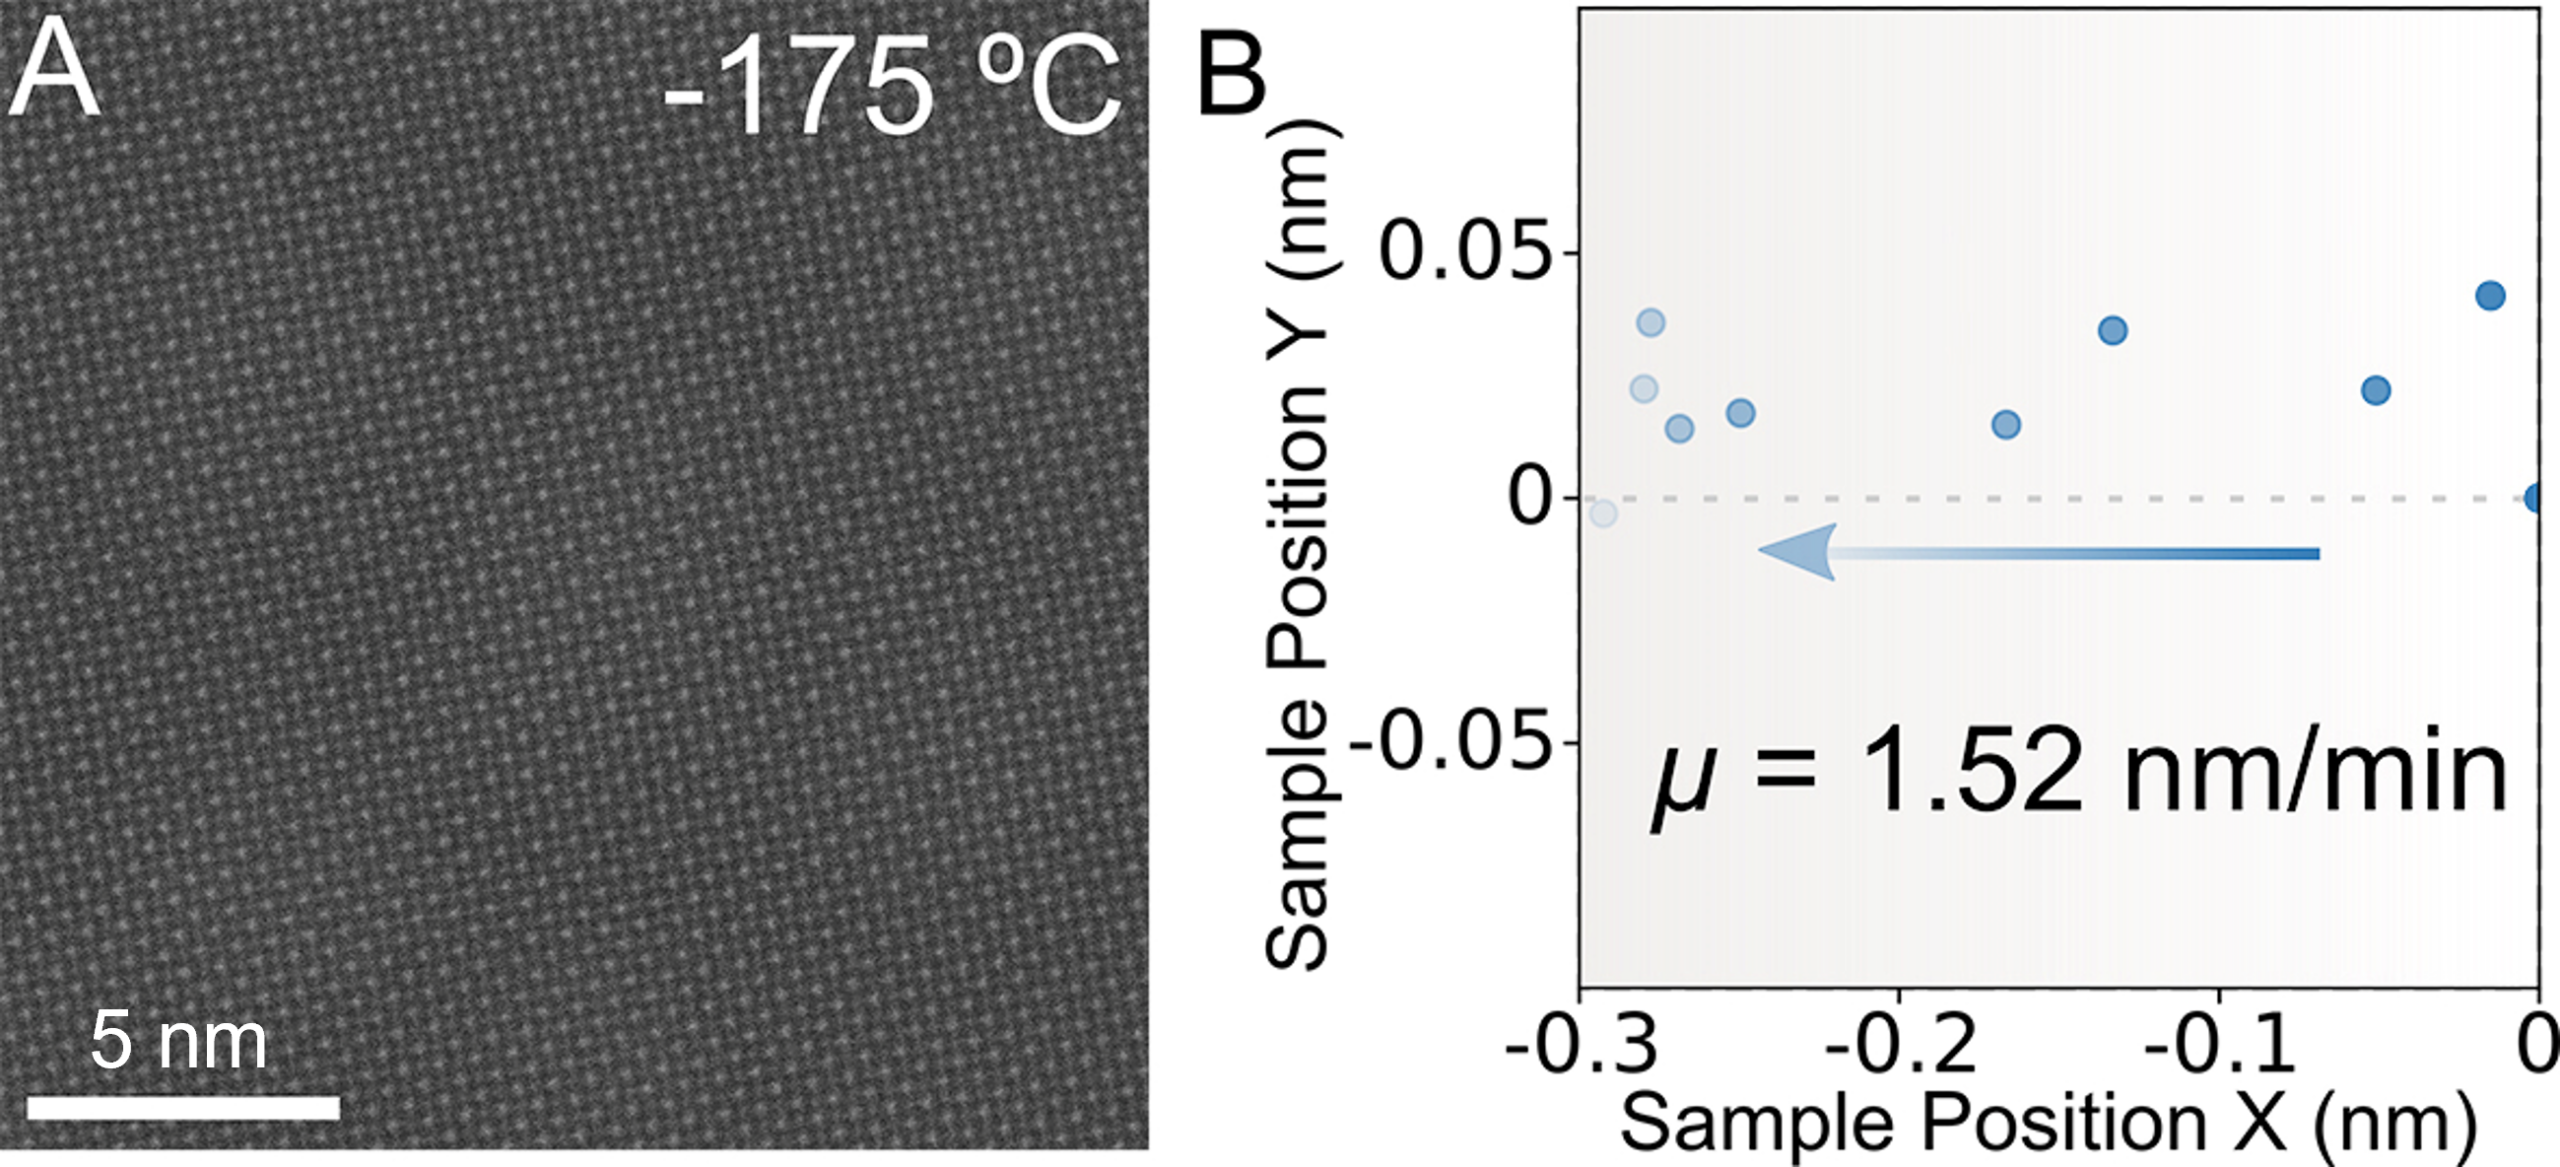
Figure 1: Drift analysis in the cryo-STEM experiment at -175 °C.

Domain evolution during heating

Ferroelectric materials exhibit phase transitions that significantly influence their domain structures, which play a crucial role in determining material performance. By applying a controlled heating profile, the researchers were able to monitor how BaTiO₃ evolves through its various phases in real time. The video below highlights the dynamic changes in domain wall (DW) configurations as the material transitions from rhombohedral (R) to orthorhombic (O), tetragonal (T) and finally cubic (C) phases. At lower temperatures, zigzag patterns formed by 60° and 120° DWs appeared in the orthorhombic phase, while 90° a-c type ferroelastic domains became prominent in the tetragonal phase. These observations showcase how temperature influences domain behavior, offering valuable insights into the structural evolution of BaTiO₃ during heating.

Movie 1: Domain evolution during the complete in situ TEM heating process.

Domain evolution during cooling

Domain wall dynamics are central to understanding ferroelectric materials, as the movement and reorganization of these walls directly influence the material’s functional performance. Monitoring these processes in real time requires both exceptional resolution and imaging stability. The video below showcases the real-time evolution of domain walls across different temperature phases, enabled by the ultra-stable capabilities of the Lightning Arctic system. The researchers captured the movement and interaction of 71° and 180° DWs in the rhombohedral phase at cryogenic temperatures. These observations provide unprecedented clarity on the spontaneous strain and polarization mechanisms that govern domain stability, offering new insights into the nanoscale processes driving ferroelectric behavior.

Movie 2: Domain evolution during the complete in situ TEM cooling process.

Advancing the frontier of ferroelectric science

Conclusively, this study highlights the power of the DENSsolutions Lightning Arctic system in enabling atomic-resolution observations of phase transitions and domain wall dynamics in single-crystal BaTiO₃ across a wide temperature range. By capturing real-time structural evolution during both heating and cooling processes, Prof. Leopoldo Molina Luna and his group were able to reveal critical insights into the behavior of ferroelectric domains under temperature-driven stimuli. These findings lay the foundation for further studies of functional materials under multi-stimuli conditions, driving advancements in their development for next-generation applications.

“DENSsolutions’ Lightning Arctic enables in situ TEM of phase transitions with atomic precision.”

Prof. Leopoldo Molina-Luna   |   TU Darmstadt

Original article:


Discover our Lightning Arctic solution:
Thomas article feature image

Lightning system helps uncover the interaction mechanism in reactive metal-ceramic system, Al-SiC

The DENSsolutions Lightning system was utilized to reveal the evolution mechanism of the Al–AOL–SiC system under heating and biasing conditions and under an ultrahigh resolution of 4 Å.
Subscribe to our newsletter to stay up-to-date with the latest in situ microscopy news.

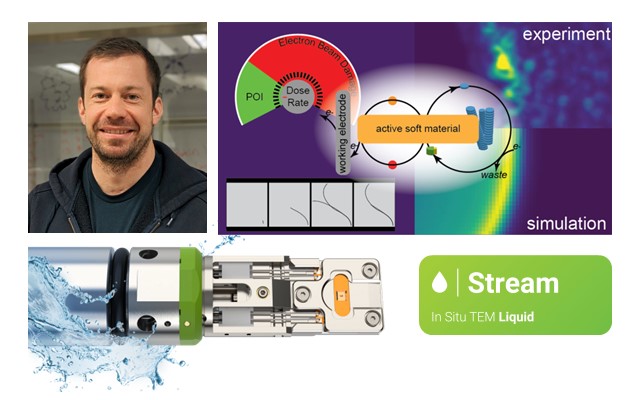
In situ LPEM: Illuminating the electrochemical nanoscale dynamics of active materials

In situ LPEM: Illuminating the electrochemical nanoscale dynamics of active materials

Using the DENSsolutions Stream system, researchers take a magnified look at the nanoscale processes governing electrochemical activity in active molecular materials.

Original article by Gibson et al.

Active materials’ ability to interact with their environment in dynamic ways makes them invaluable across numerous fields, enhancing the functionality, efficiency and sustainability of various products and technologies that we use daily. This includes bio-sensors, flexible electronics, water purification and solar cells. Indeed, a thorough comprehension of the behavior of active materials under electrochemical conditions is crucial for their development. While substantial efforts have been made to understand the self-assembly mechanisms of biologically active materials, there is currently a large knowledge gap on how synthetic active materials behave. Traditional microscopy techniques often fall short in capturing the real-time dynamics of materials immersed in liquid environments. This is where liquid phase electron microscopy (LPEM) comes into play, offering a powerful solution to bridge this gap.

In a recent study published in the renowned journal of ACS Nano, a team of researchers from the University of California (UC) Irvine and the University of Massachusetts Boston employed the DENSsolutions Stream system to investigate the dynamics of electrochemically driven active materials. Impressively, they were able to capture single fiber dynamics at subsecond temporal resolution, as well as larger transitory fiber foci structures with nanoscale resolution. This research, involving our dear user at UC Irvine, Prof. Dr. Joe Patterson, is a major step forward in using electrochemical liquid EM to understand the dissipative self-assembly processes that generate active materials – a research space that remains largely unexplored. Notably, our Stream system played a vital role in enabling the visualization of these intricate electrochemical processes, providing key insights into the relationship between chemical kinetics and material dynamics.

Hierarchical evolution of fiber dynamics

The nanoscale self-assembly processes observed in this study involve the electrochemical oxidation of a free cysteine thiol precursor (CSH) molecule to its disulfide gelator form (CSSC) using the ferricyanide/ferrocyanide redox couple as a electrochemical catalyst. For the experiments, Wyeth Gibson and his fellow collaborators utilized the Stream Nano-Cell’s working electrode as the anode, which provided the driving force for the oxidation of ferrocyanide to ferricyanide and the follow-up oxidation of CSH to CSSC. 

After capturing the dynamics of individual fibers under electrochemical stimulation near the electrode, the researchers were then able to capture the micrometer-scale hierarchical evolution of fiber clusters. As shown in the movie below, the fiber foci experience a maximum growth at 87 s and disassembly at 167 s. Evidently, the overall growth and shrinking of the fiber foci seem to loosely correspond with application and removal of electrochemical stimulus.

Movie 1: LPEM movie depicting the fiber foci growth and disassembly 

Capturing fiber foci modification

The next step for the researchers was to study the active material’s dynamics in response to further electrochemical stimulus. They applied a current to the structures and activated the electron beam, which was maintained at a constant throughout the experiment.  As shown in Movie 2 below, for the first 100 seconds, the fiber foci remained stable. At 100 s, a self-assembly growth front moved from left to right, causing the structures to grow and increase in contrast. At 200 s, a second growth front emerged as the first front reached the electrode boundary, spreading outward from the electrode in all directions. Between 400 and 600 seconds, the structures began to break down, shrink and decrease in contrast across the viewing window.

Movie 2: LPEM movie depicting the electrochemically driven fiber foci modification

Movie 3: LPEM movie depicting the fiber foci modification

Next, a regional segmentation analysis was performed in order to quantify the observed wave-like propagation of these self-assembly fronts. This is depicted in Movie 3, whereby the middle panel shows the segmented particles corresponding to the LPEM movie shown in the left panel. The graph in the video depicts the normalized change in segmented particle area over time for each region, with the segmented regions represented by blue (closest to the electrode), purple, red, and yellow (farthest from the electrode).

It is evident that the distance from the electrode affects the maximum structural density in a sequential manner. Notably, Dr. Gibson and his collaborators effectively demonstrate that the active material can be dynamically manipulated to form multiple growth fronts influenced by electrodes at different spatial locations.

Next, a regional segmentation analysis was performed in order to quantify the observed wave-like propagation of these self-assembly fronts. This is depicted in Movie 3, whereby the middle panel shows the segmented particles corresponding to the LPEM movie shown in the left panel. The graph in the video depicts the normalized change in segmented particle area over time for each region, with the segmented regions represented by blue (closest to the electrode), purple, red, and yellow (farthest from the electrode). It is evident that the distance from the electrode affects the maximum structural density in a sequential manner. Notably, Dr. Gibson and his collaborators effectively demonstrate that the active material can be dynamically manipulated to form multiple growth fronts influenced by electrodes at different spatial locations.

Movie 3: LPEM movie depicting the fiber foci modification

Integrating observations with simulations

To gain a clearer understanding and measure the structural transformation within the liquid cell, the researchers utilized structural dissimilarity (DSSIM) analysis on the electrochemical LPEM video. DSSIM analysis is a video processing technique that spatially and temporally quantifies structural changes occurring in a video. Importantly, by combining the LPEM data with kinetic simulations, they discovered that the formation of an active material can foster a local environment that boosts the pace of the self-assembly process, exhibiting an autocatalytic behavior.

Movie 4: DSSIM visualization and quantification of fiber foci dynamics

A pioneering electrochemistry study

Conclusively Prof. Dr. Joe Patterson and his fellow researchers performed a cutting-edge study, employing a combination of techniques including LPEM, electrochemical analysis, quantitative video analysis and kinetic simulations to explore a widely untapped research space – the self-assembly mechanisms in electrochemically fueled active materials. This innovative research highlights the crucial role of liquid electron microscopy in studying active materials, offering vital insights into the interplay between chemical kinetics and material behavior. We are certainly proud of the key role that our Stream system has played in bringing this research to fruition, and we look forward to the pioneering academic contributions that the Patterson Lab will continue to deliver.

“These were the most challenging liquid electron microscopy experiments I have ever performed, and the DENSsolutions Stream system was essential for getting them to work.”

Prof. Dr. Joe Patterson   Professor  |  University of California Irvine

Original article:


Discover our Stream solution:

Subscribe to our newsletter to stay up-to-date with the latest in situ microscopy news.

Breaking boundaries: Electrochemical impedance spectroscopy meets environmental TEM

Breaking boundaries: Electrochemical impedance spectroscopy meets environmental TEM

Employing the DENSsolutions Lightning system, researchers were able to apply a novel integrated EIS-ETEM approach to a common ceramic electrolyte, subjecting it to an array of stimuli, such as reactive gases, elevated temperatures and applied electrical potentials.

Original article by Ma et al.

Preparing and conducting high-temperature solid-state electrochemical TEM – particularly relevant to solid oxide fuel and electrolysis cells (SOFC and SOEC) – poses a number of challenges. These challenges include ensuring mechanical stability during chip mounting, preventing sample fracture or loss of electrical contact and minimizing unavoidable leak currents through the chip components. Despite its many challenges, the integration of electrical impedance spectroscopy and environmental TEM uniquely facilitates the direct correlation between electrochemical activity and the nanoscale structure and composition of materials. In a recent paper published in Small Methods – involving our dear user at the Technical University of Denmark (DTU), Dr. Søren Bredmose Simonsen – the DENSsolutions Lightning system was utilized to study micro gadolinia-doped ceria (CGO). The behavior of CGO, a ceramic electrolyte with various electrochemical properties, was investigated under a diverse range of stimuli, including reactive gasses (O₂ and H₂/H₂O), elevated temperatures (room temperature — 800 °C) and applied electrical potentials. Importantly, this research marks a significant advancement in materials science, pioneering the integration of EIS with in situ ETEM. 

CGO sample structure

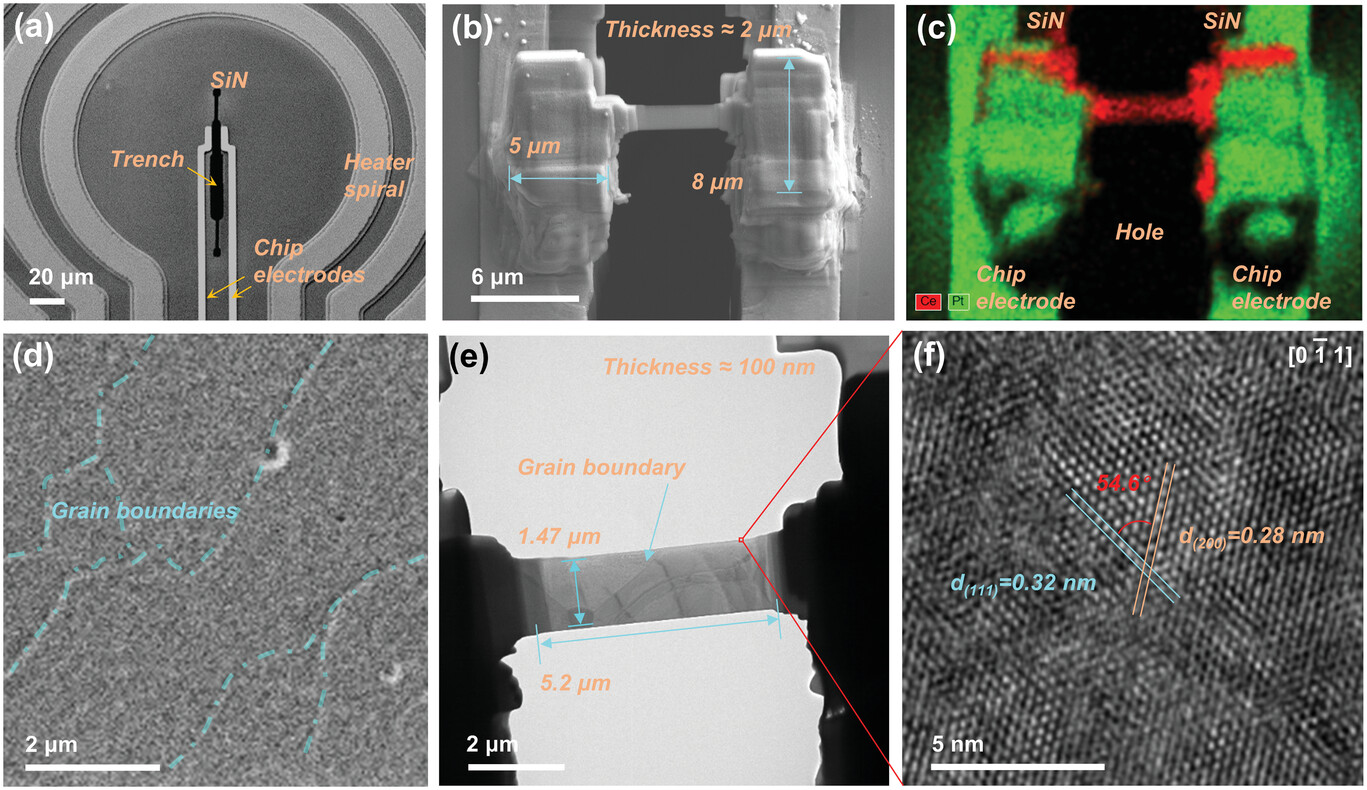
Dr. Simonsen and his fellow collaborators meticulously designed the CGO sample for operando EIS-TEM investigations. A snapshot of the mounting process on the DENSsolutions Lightning Nano-Chip is shown in Figure 1b below. With a thin central part flanked by thick side parts, this sample configuration facilitates the separation of the contribution of bulk charge transport and the surface reaction processes. Notably, Dr. Simonsen emphasized the unique benefits of the Lightning Nano-Chip, highlighting its advantageous geometry. He explained, “The geometry of the DENSsolutions Lightning Nano-Chip is uniquely beneficial for our studies as it features a relatively long distance between the heater and the sample region. This allows us to mount and post-thin samples without the risk of creating pathways for leak current between the heater and sample or biasing electrodes.”

Figure 1: CGO sample mounted on a DENSsolutions Lightning Nano-Chip, visualized by SEM, TEM and HRTEM imaging.

EIS electrical circuit model

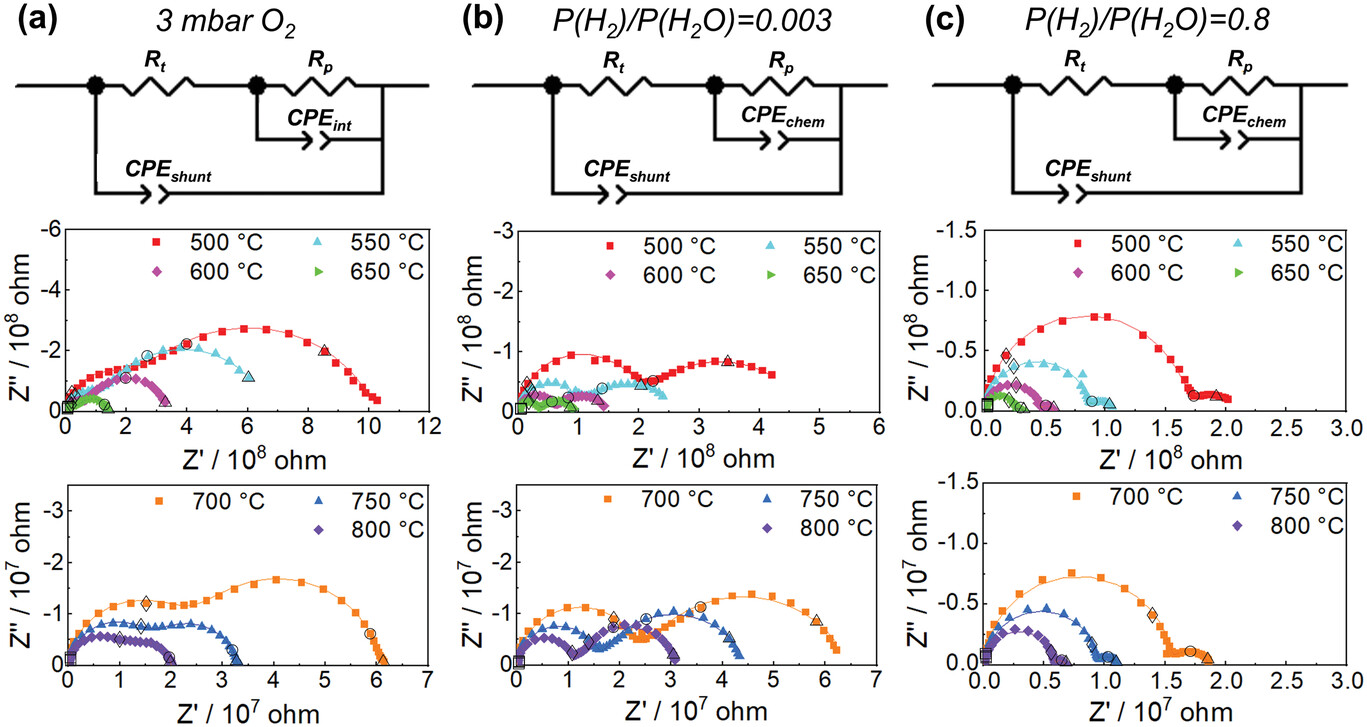
The researchers then explored the EIS spectra under three different gas environments at temperatures from 500 °C to 800 °C (see Figure 2 below). The Nyquist plots from EIS data reveal two distinct arcs, each representing different electrochemical processes. Through electrical circuit modeling, the contributions of resistances and capacitances are shown. Notably, the surface exchange reaction resistance exhibits a clear temperature dependence, reflecting thermally activated processes for both the transport and surface reaction.

Figure 2: EIS spectra (symbols) and fittings (lines) recorded in a) 3 mbar O₂ and in a H₂/H₂O with partial pressure ratio of b) 0.003 and c) 0.8; 10 kHz (square); 100 Hz (diamond), 1 Hz (circle), 0.1 Hz (triangle) are noted on the spectra, with hollow symbols.

Schematic illustration of CGO sample

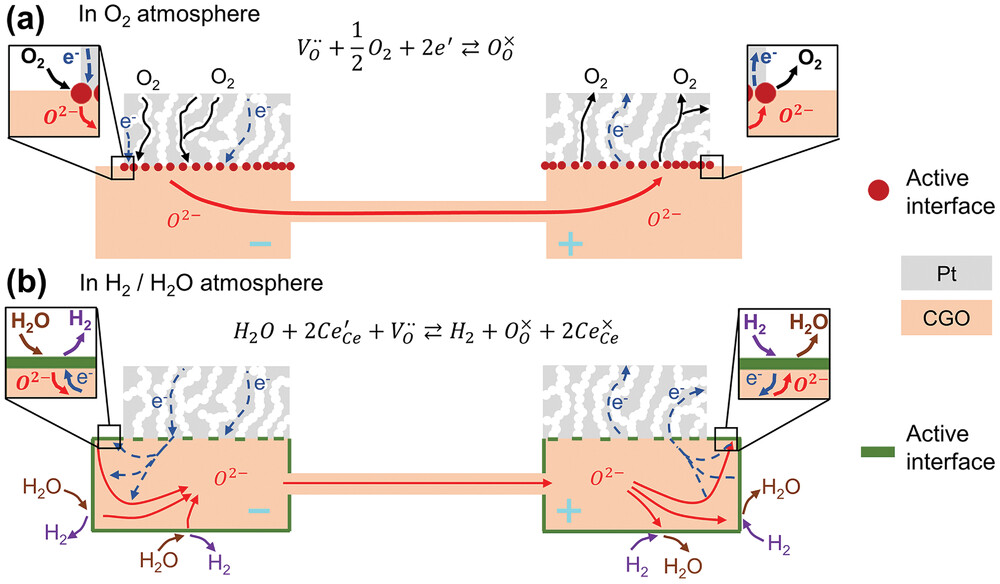
In Figure 3 below, a schematic diagram of the differences for the CGO TEM sample in O₂ and H₂/H₂O is presented. Notably, in both O₂ and H₂/H₂O atmospheres, the conductivity and surface exchange reaction of CGO demonstrate notable dependencies on the gas environment. In the two scenarios, there are distinct chemical reaction formulas. In O₂, CGO predominantly conducts ions, confining the active surface near the Pt current collector. However, in the H₂/H₂O environment, electrons flow through CGO’s side parts, activating the entire surface.

Figure 3: Illustration of active surface area for Pt-CGO as a) pure ionic conductor and as b) mixed electronic/ionic conductor. Arrows indicate the direction of ions (red) and electrons (navy).

Electrochemical EIS meets TEM

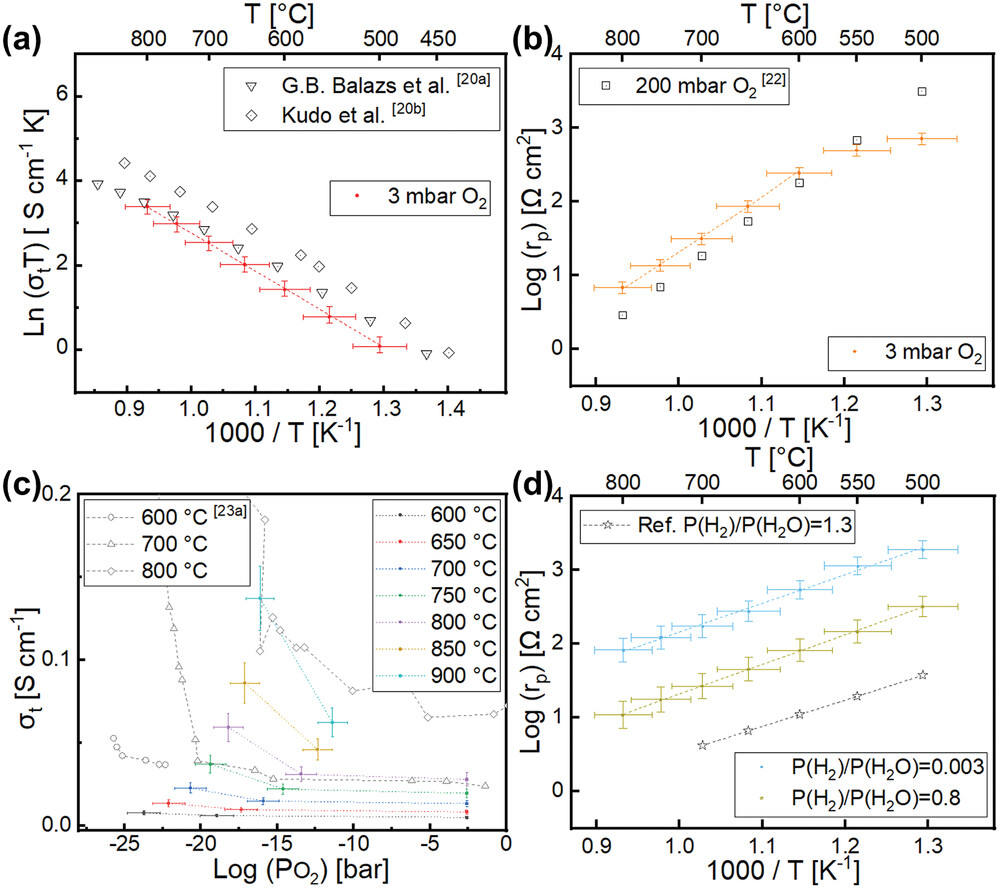
The researchers then analyzed the transport and surface exchange resistance from the EIS measurements in each type of gas environment separately. Figure 4 below delves into the temperature and oxygen partial pressure (pO₂) dependence of CGO conductivity and surface exchange resistivity in different gas atmospheres. Notably, the conductivity in O₂ exhibits a characteristic temperature-dependent behavior, aligning closely with reference data for bulk polycrystalline CGO. Conversely, in H₂/H₂O environments, the conductivity shows a marked increase with decreasing oxygen partial pressure, indicative of a shift towards mixed electronic and ionic conduction. Moreover, the surface exchange resistance demonstrates a consistent decrease with increasing H₂/H₂O ratio, underscoring the influence of electronic charge carriers on electrochemical processes. 

Figure 4: Electrochemical EIS-TEM measurements of CGO in different atmospheres via Arrhenius plots.

A novel integration

Dr. Simonsen and his fellow collaborators performed a comprehensive in situ TEM heating and biasing study using the DENSsolutions Lightning system, elucidating the nuanced interplay between gas environment, temperature and material properties of micro gadolinia-doped ceria, a common ceramic electrolyte. This innovative research taps into new academic frontiers by combining electrochemical impedance spectroscopy with in situ environmental transmission electron microscopy investigations. Importantly, the developed EIS-TEM platform in this study is an important tool in promoting the understanding of nanoscale processes for green energy technologies, such as solid oxide electrolysis/fuel cells, batteries, thermoelectric devices and many more. 

“The geometry of the DENSsolutions Lightning Nano-Chip is uniquely beneficial for our studies as it features a relatively long distance between the heater and the sample region. This allows us to mount and post-thin samples without the risk of creating pathways for leak current between the heater and sample or biasing electrodes. Moreover, if not for the Lightning system’s low internal capacitance and high resistance, it would not have been possible to conduct electrochemical measurements for our materials.”

Dr. Søren Bredmose Simonsen   Senior Research  |  Technical University Denmark

Original article:


Discover our Lightning solution:

Discover more publications made possible by Lightning:

Thomas article feature image

Lightning system helps uncover the interaction mechanism in reactive metal-ceramic system, Al-SiC

The DENSsolutions Lightning system was utilized to reveal the evolution mechanism of the Al–AOL–SiC system under heating and biasing conditions and under an ultrahigh resolution of 4 Å.
Subscribe to our newsletter to stay up-to-date with the latest in situ microscopy news.

DENSsolutions’ Lightning system helps uncover the interaction mechanism in reactive metal-ceramic system, Al-SiC

DENSsolutions’ Lightning system helps uncover the interaction mechanism in reactive metal-ceramic system, Al-SiC

Using the DENSsolutions Lightning system, researchers were able to provide an electrical, chemical and structural analysis of the Al–amorphous SiO₂–SiC interface at high temperatures.

Original article by Adabifiroozjaei et al.

The use of hybrid materials containing both metals and ceramics has become increasingly popular within manufacturing and microelectronic industries due to their optimized and well-balanced properties. Aluminum-silicon carbide (Al-SiC) is a widely known metal-ceramic composite material, commonly used in microelectronic packaging for automotive and aerospace applications. In Al-SiC an amorphous oxide layer (AOL) of SiO₂ is known to exist between the Al and SiC. Notably, the mechanism of interaction between the reactive metal (Al) and ceramic (SiC) and the AOL (SiO₂) under the heat-treatment process is still not well-understood. In fact, numerous theories about the interaction mechanism have been proposed over the past few decades. The major problem is that the studies conducted so far, regardless of the mechanism proposed in them, were ex situ and therefore not capable of resolving the atomic-scale nanostructural and chemical changes occurring at the interfaces during the heat-treatment process. In a recent paper published in the Journal of Materials Science, involving our valued users at TU Darmstadt, Dr. Esmaeil Adabifiroozjaei and Dr. Leopoldo Molina-Luna, the DENSsolutions Lightning system was utilized to reveal the evolution mechanism of the Al–AOL–SiC system under heating and biasing conditions. This study involved a team of researchers from institutes all over the world, including the University of Tabriz in Iran, NIMS and Shibaura Institute of Technology in Japan, and UNSW Sydney in Australia. 

Sample preparation

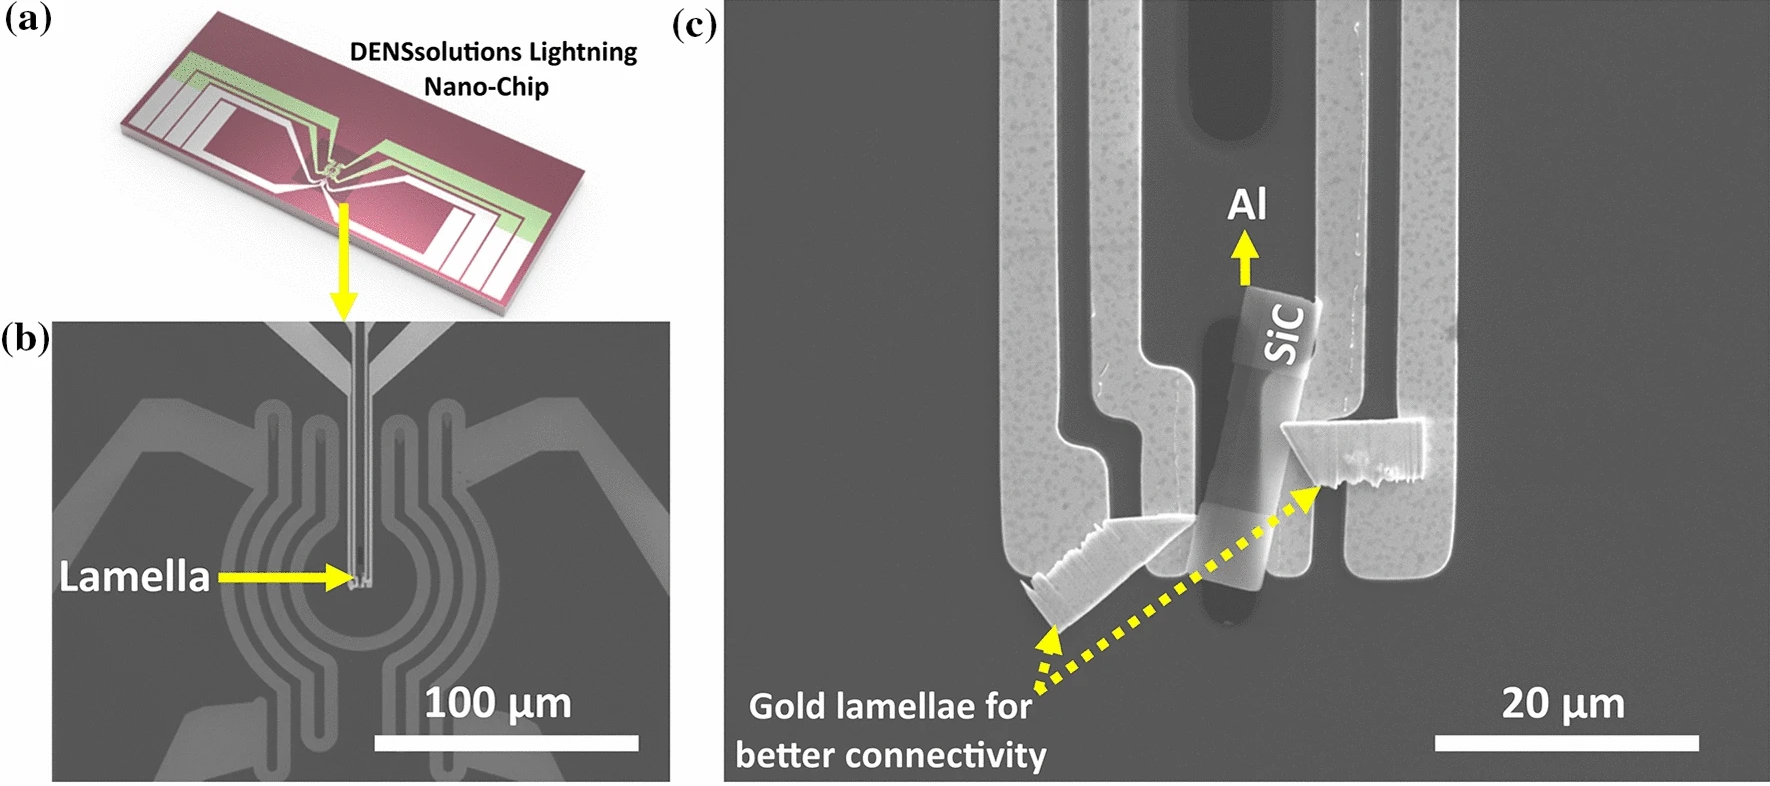
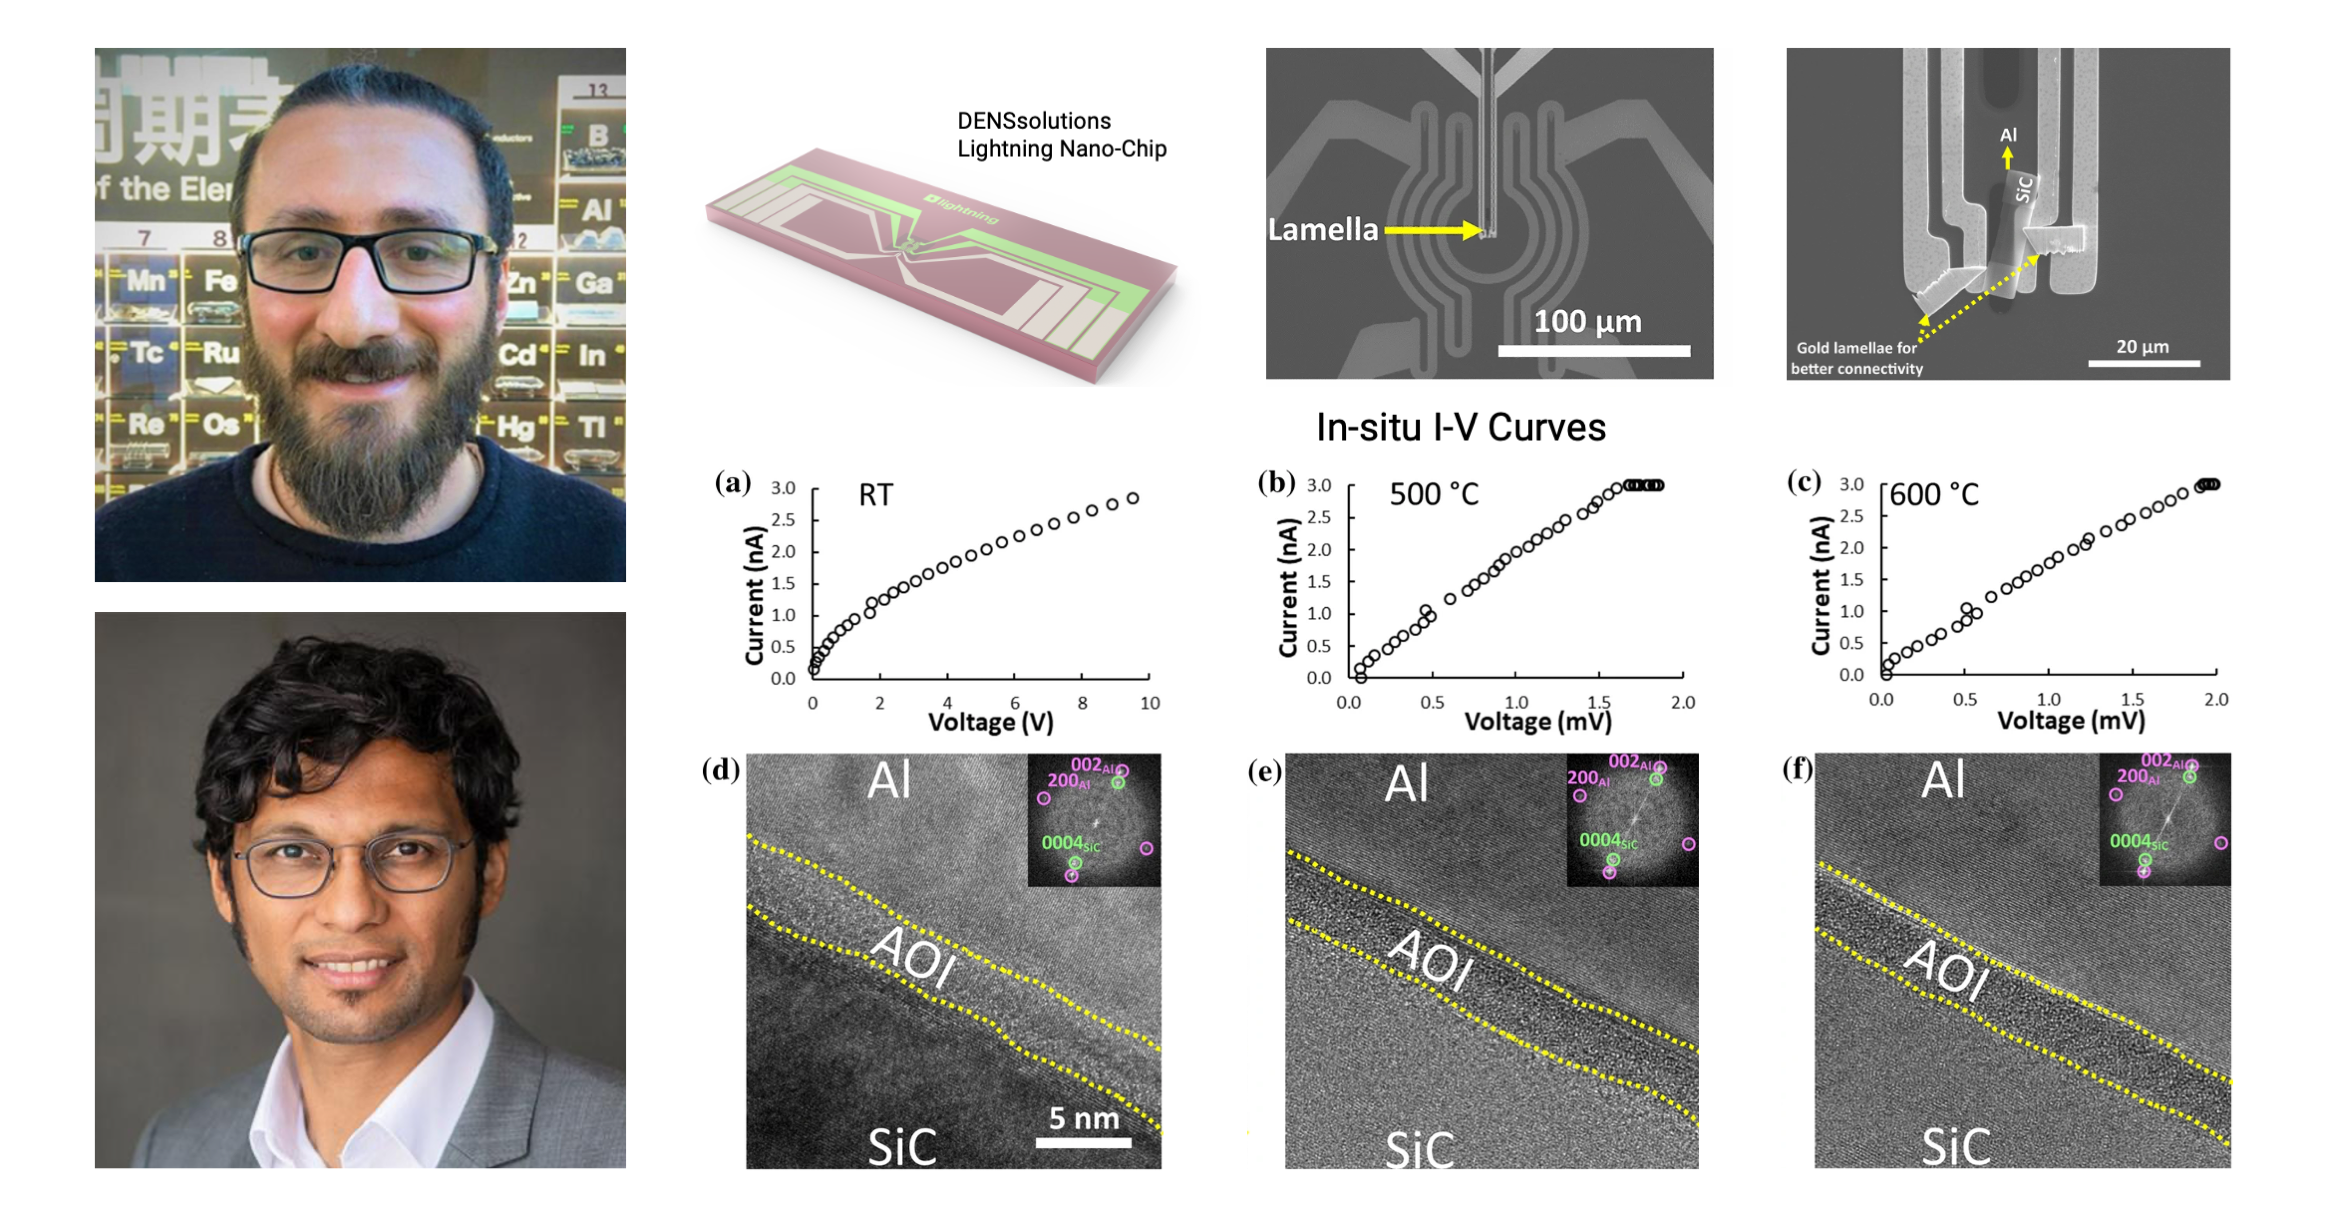
The first step for Dr. Adabifiroozjaei and his fellow collaborators was to carefully prepare the Al-SiC sample. After ultrasonically cleaning the SiC wafer, removing the oxide layer and allowing its regrowth by inserting the wafer into a desiccator, an Al layer with a thickness of ~1 µm was sputtered on the wafer using Shibaura’s CFS-4EP-LL sputtering machine. Next, in order to prepare the lamella, the researchers applied focused ion beam milling using JEOL’s JIB-4000 FIB. The prepared lamella was then loaded onto the DENSsolutions Lightning Nano-Chip (see Figure 1a). The low- and high-magnification scanning electron microscopy (SEM) images of the chip and the loaded lamella are shown below in Figure 1b) and 1c), respectively. Next, an Au lamella was prepared by FIB and connected to Al–AOL–SiC lamella and chip in order to ensure electrical current passes through Al–AOL–SiC lamella.

Figure 1: a) DENSsolutions Lightning Nano-Chip used for the in situ heating and biasing experiment, b) low- c) and high-magnification SEM images of the loaded lamella on the Nano-Chip, respectively.

Experimental results

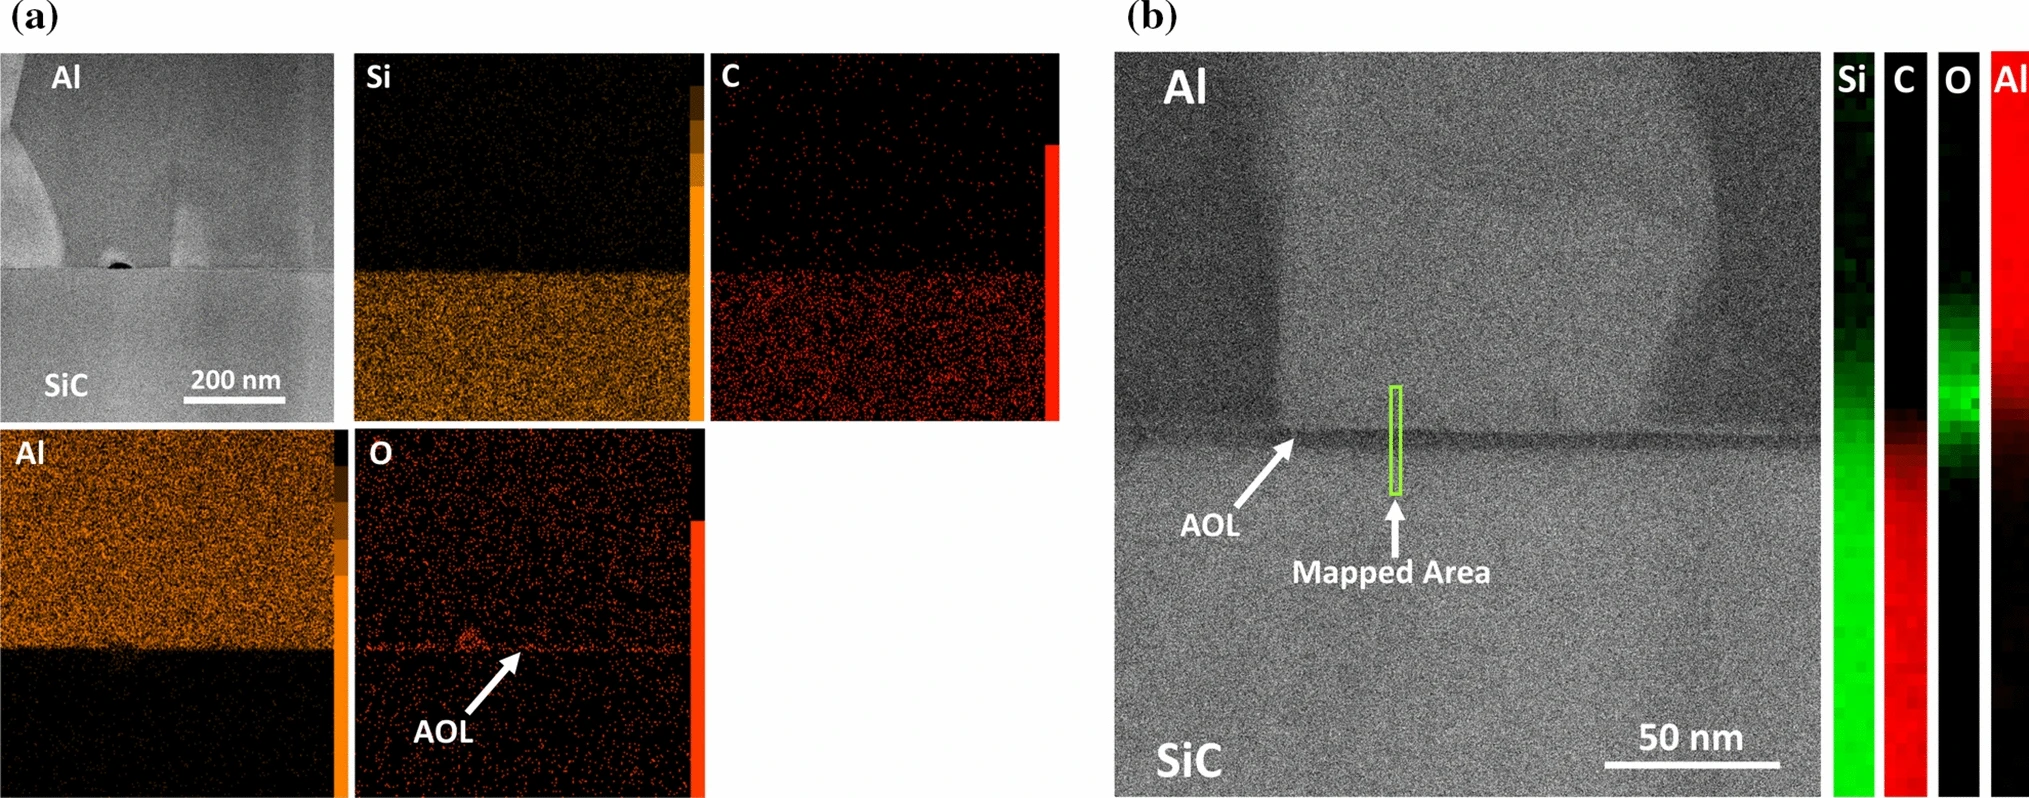
The researchers performed EDX and EELS elemental mapping to determine the chemical composition of the phases across the Al–AOL–SiC interface. The EDS mapping of the interface is shown in Figure 2a), while the high-resolution EELS elemental mapping of the interface is shown in Figure 3b) – both of which reveal the consistent presence of a narrow oxide layer with a thickness in the range of 3–5 nm. 

Figure 2: a) EDS elemental mapping of Al–AOL–SiC interface, showing the presence of the AOL, b) STEM-HAADF image of Al–AOL–SiC interface and its EELS map profile.

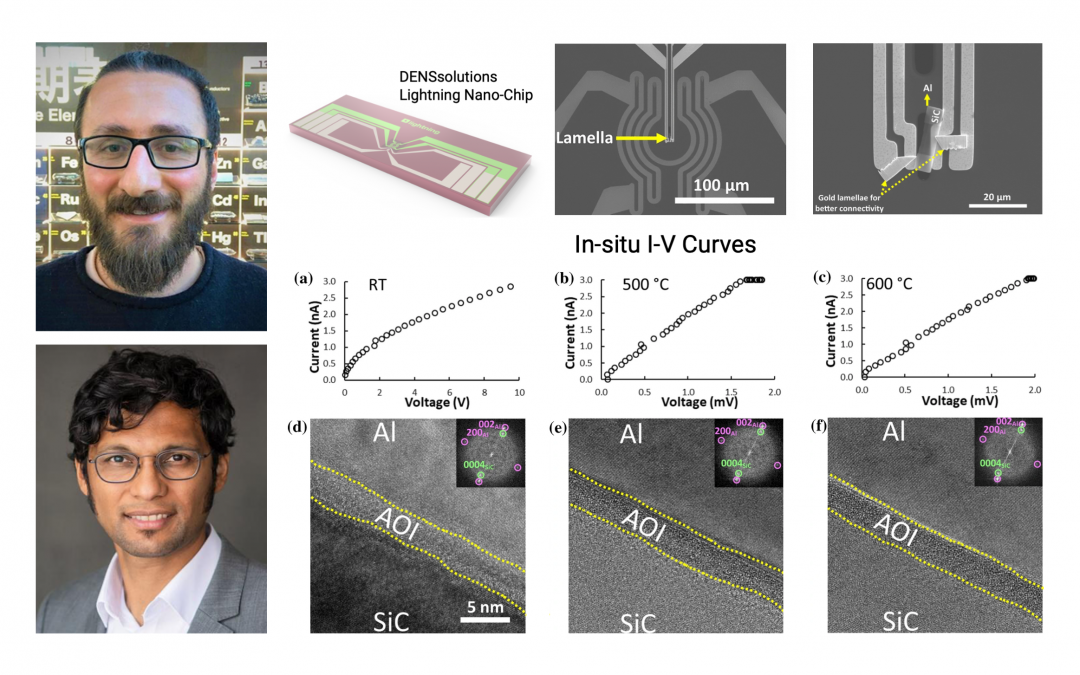
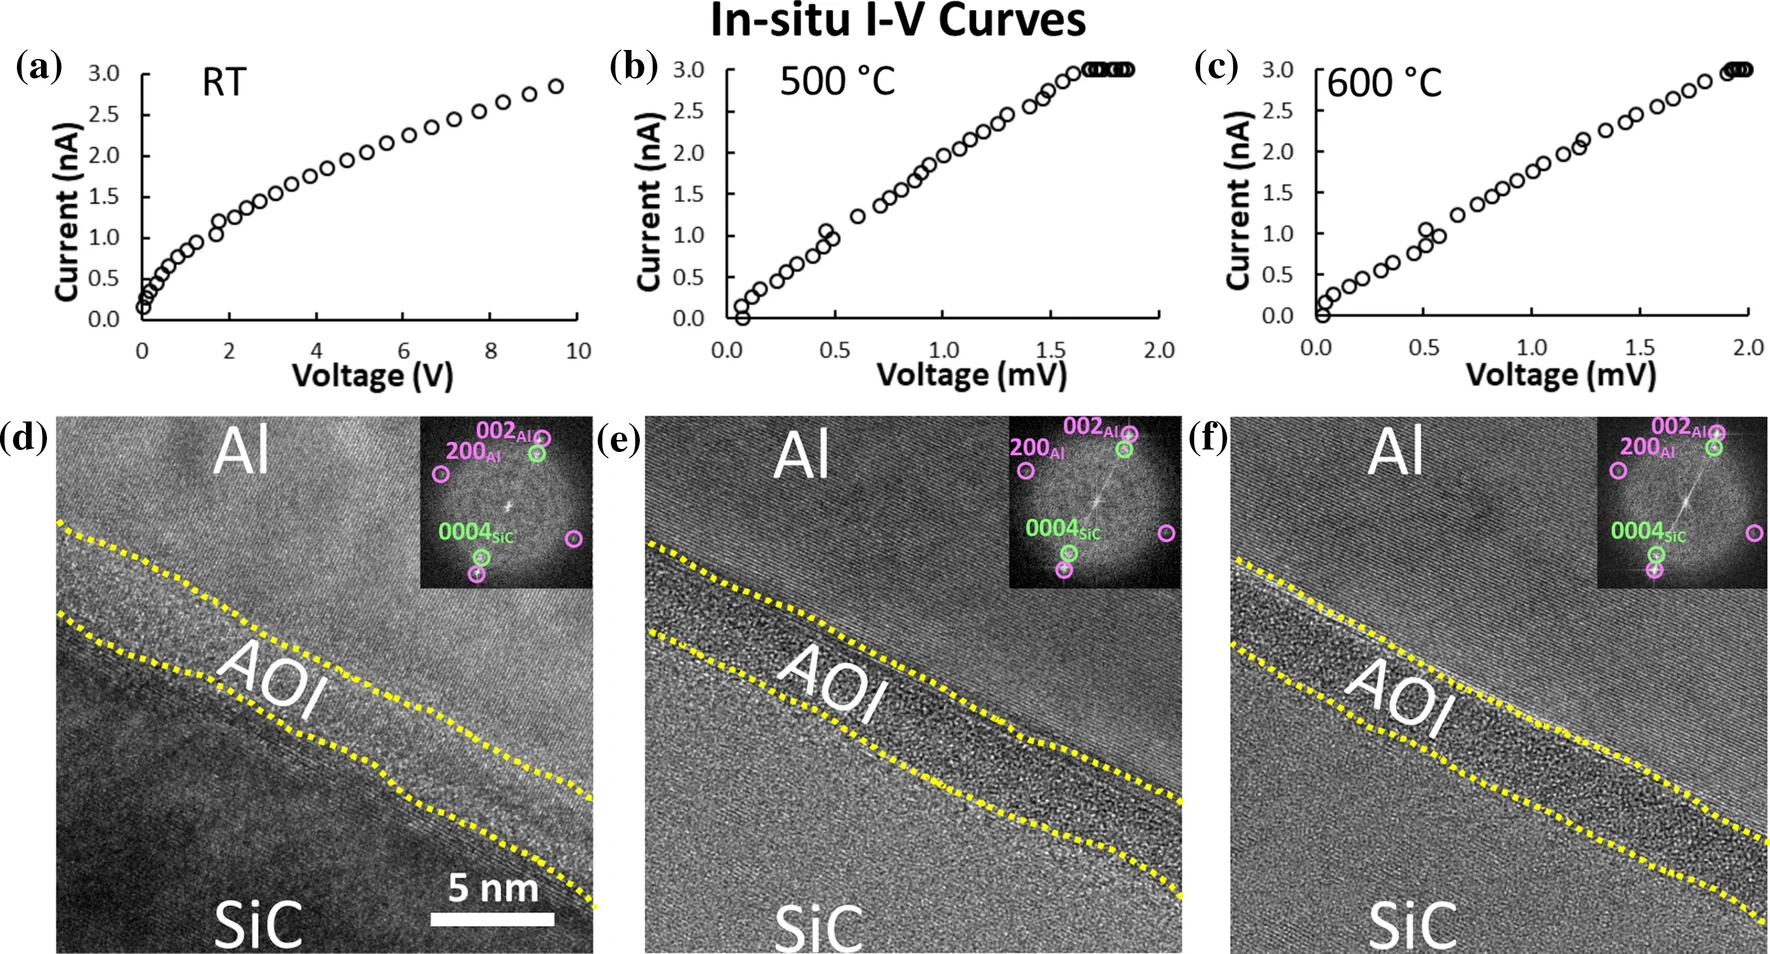
Next, the researchers began with the in situ heating and biasing experiment to study the electrical characteristics of the lamella. First, a compliance current was set to 3 nA, then the voltage required to reach such a current was recorded at each temperature. The acquired I–V curves for room temperature, 500 ° and 600 °C after 30 minutes of application of the field are presented in Figure 3a–c), respectively. The I–V curves and high resolution TEM images (shown in Figure 3d–f) indicate that the resistivity of the Al–AOL–SiC device decreased three orders of magnitudes at 500 °C with no apparent change in the nanostructure. 

Figure 3: a), b), and c) show the I–V curves of Al–AOL–SiC interface measured at room temperature, 500° and 600 °C, respectively. d), e), and f) show the high-magnification images of Al–AOL–SiC interface from a small area of low-magnification images.

The chemical changes occurring at the interface during the heating process were investigated on another lamella using the same DENSsolutions Lightning holder, but on a Wildfire (heating-only) Nano-Chip. HAADF-STEM images and EELS chemical profiles were acquired and the results are shown in Figure 4 below. 

Figure 4: a), b), c ) and d) show changes in chemistry (line profiles of Al (Aqua), Si (Violet), C (Lime), and O (Yellow)) of Al–AOL–SiC interface at room temperature (25°), 550°, 500° and 600 °C, respectively.

During this analysis, the researchers observed that at 550 °C, the AOL width was reduced, which was specifically due to AOL dissolution into the Al. Moreover, the analysis of the structural changes at the interface nanostructure at 600 °C showed that the dissolution of the SiO₂ amorphous layer resulted in the formation of α-AlO and Si within the Al. In contrast, the elemental interdiffusion (Al³⁺ ⇄ Si⁴⁺) between Al and SiC was observed to occur, resulting in formation of AlC. From the results, we can infer that the reaction mechanism between Al and crystalline SiC is different with that between Al and SiO₂ amorphous phase.

Conclusion

Dr. Adabifiroozjaei and his fellow collaborators performed a comprehensive in situ STEM heating and biasing study using the DENSsolutions Lightning system, investigating the electrical, chemical and microstructural features of the interface of a Al–AOL–SiC system. Performing this study under an ultrahigh resolution of 4 Å allowed the researchers to confirm, for the first time in literature, that the reaction mechanism between reactive Al and crystalline SiC is different than between Al and amorphous SiO₂. Specifically, they found that whereas the reaction between SiO₂ and Al follows the dissolution mechanism, the reaction between SiC and Al proceeds through elemental interdiffusion. Importantly, these findings might be applicable to other reactive metal-ceramic systems that are currently used in manufacturing and electronic industries.

“With the stability and accuracy provided by DENSsolutions Lightning system, we could reveal features of an interfacial interaction in a common metal-ceramic system (Al-SiC) that were not previously observed. Such studies at very high resolution are absolutely necessary for the understanding and future development of composite materials at elevated temperatures.” 

Prof. Dr. Leopoldo Molina-Luna   Professor  |  TU Darmstadt

Original article:


Discover our Lightning solution:

Discover more publications made possible by Lightning:

Thomas article feature image

Liquid flow control: Unlock untapped research capabilities within in situ LPEM

Using the DENSsolutions Stream system, researchers were able to create a highly controlled chemical environment for visualizing the nanoscale metallic electrodeposition of copper crystals.

Subscribe to our newsletter to stay up-to-date with the latest in situ microscopy news.

New measuring technique proves exceptional temperature accuracy of our Wildfire Nanochip

New measuring technique proves exceptional temperature accuracy of our Wildfire Nanochip

In collaboration with Utrecht University, we develop a novel technique to measure temperature at the nanoscale, showing the remarkable temperature accuracy and homogeneity of our Wildfire Nanochip

Original article by Thomas P. van Swieten, Tijn van Omme, Dave J. van den Heuvel, Sander J.W. Vonk, Ronald G. Spruit, Florian Meirer, Hugo Pérez Garza , Bert M. Weckhuysen, Andries Meijerink, Freddy T. Rabouw and Robin G. Geitenbeek
Thomas article feature image

The temperature-sensitive luminescence of nanoparticles enables their application as remote thermometers. In fact, the size of these nanothermometers makes them ideal to map temperatures with a high spatial resolution. Yet, conducting high spatial resolution mapping of temperatures that exceed 100°C poses some challenges.

In collaboration with Thomas van Swieten and his fellow colleagues at Utrecht University, we were able to jointly develop a new technique to measure temperature at the nanoscale. In fact, we tested this novel technique on our Wildfire Nanochip and were able to further confirm the Nanochip’s unparalleled temperature accuracy and homogeneity. These experiments also proved how well our models work to predict the temperature distribution across the microheater. Importantly, this particular technique will improve the accuracy of nanothermometry as a whole, not only in micro- and nano-electronics but also in other fields with photonically inhomogeneous substrates.  

The technique: Luminescence nanothermometry

Thermometry on the microscopic scale is an essential characterization tool for the development of nano- and microelectronic devices. However, conventional thermometers like thermocouples are often unable to reliably measure the temperature on this length scale due to their size. This is precisely where remote temperature sensing via optical thermometry techniques comes into play. Thermometry based on luminescence is particularly interesting since it is easily implemented, requiring only the deposition of a luminescent material in or on a sample of interest and the detection of its luminescence. For this reason, luminescence nanothermometry is currently developing into the method of choice for temperature measurements in microscopy.

Homogeneous heat distribution

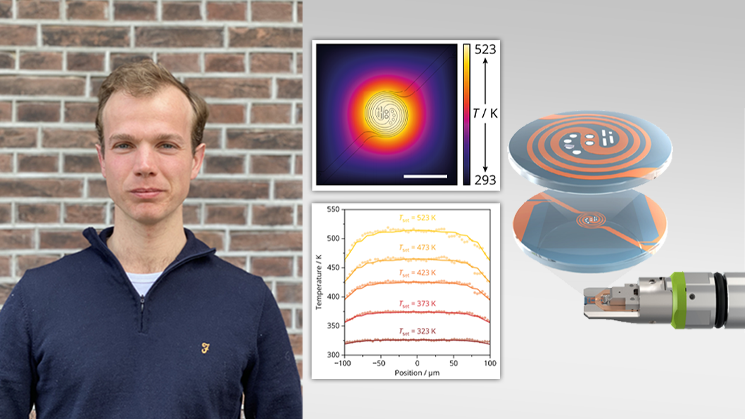
Our Wildfire Nanochip was specifically designed to enable users a homogeneous heat distribution across the microheater where a sample is positioned. It is particularly due to the unique geometry of the metal spiral, where the windows are placed right at the center, that users are able to enjoy such a remarkable temperature homogeneity. In fact, our Wildfire Nanochip has a temperature uniformity of 98% across the window area and 99.5% across the two central windows. The figure on the right below is a perfect illustration of the chip’s exceptional temperature homogeneity, showing the temperature profile across the membrane and the microheater for a center temperature of 523 K simulated with a finite element model.

The high temperature homogeneity of our Wildfire Nanochips is also owed to the fact that the metal heating spiral is embedded in a silicon nitride membrane. Silicon nitride has many advantages including being chemically inert, mechanically robust and can withstand harsh chemical and temperature environments. 

Tijn article - figure 2 wildfire nanochip homogeneous distribution

On the left: The Wildfire Nanochip, where the metal spiral is represented in orange and the silicon nitride membrane in blue. On the right: Finite element model simulation showing the remarkable temperature homogeneity of the Wildfire Nanochip

Reliable temperature mapping

In this work, the luminescent particles that were used are NaYF₄ nanoparticles doped with Er³⁺ and Yb³⁺. These particles exhibit a strong upconversion when excited with an infrared laser. In other words, they emit photons with a shorter wavelength than the excitation photons. As shown in the figure below, we found that the spectrum of the emitted (green) photons is quite sensitive to temperature.

Tijn article - Figure 1 Intensity vs Wavelength

Green upconversion luminescence of the nanoparticles upon excitation at various temperatures ranging from 303 K (dark red) to 573 K (yellow)

By scanning the laser across a layer of deposited nanoparticles in the confocal microscope, we were able to capture an array of emission spectra. We then converted this emission spectra into a temperature map using the luminescence intensity ratio of the 2 peaks at each pixel. After a number of correction steps, the technique showed a remarkable precision of 1-4 K with a spatial resolution of ∼1 micrometer. It is noteworthy to mention that most other techniques are unable to achieve such a high accuracy like this.

Tijn article - Figure 3 DESKTOP reliable temperature mapping

In a) we scanned the laser across the microheater with the deposited luminescent nanoparticles to generate a map of intensity ratios. b) shows the spectrum at each pixel converted into a temperature to provide a temperature map of the microheater.

Simulation and model accuracy

Using the fully corrected temperature maps, we were able to analyze in depth the temperature homogeneity of the microheater. The figure below shows the horizontal traces through the center of these maps. The simulated temperature profiles (lines) show an excellent match with the experimental traces (dots).This confirms both the reliability of the finite element model as a design tool and the strength of our temperature mapping technique as a characterization tool, achieving a high accuracy and a spatial resolution of ∼1 μm.

Tijn article - temperature mapping in graph

A graph showing the mapping of elevated temperatures. The lines represent the simulated temperature profiles and the experimental traces represent the dots.

We determine the standard deviation of the temperature in the center to quantify the accuracy of this thermometry method and find values of 1 K at 323 K increasing to only 4 K at 513 K. Conclusively, this makes nanothermometry using confocal luminescence spectroscopy a promising method to map temperature profiles not only for microheaters but also in other fields such as biology and catalysis where temperature variations are important but hard to monitor with conventional methods.
Tijn portrait image
“Thanks to the exceptionally good spatial and temperature resolution of this method, we were able to obtain an accurate temperature map of our microheater spiral. This confirmed the excellent temperature homogeneity which was predicted by our finite element models.”
Tijn van Omme
Microsystems Engineer |  DENSsolutions

Original article:

Discover our Wildfire solution:

Discover more publications made possible by Wildfire:

Markus article feature image

The first in situ observation of layered metastable heterostructure formation

Using our Wildfire system, scientists are able to thoroughly investigate the formation of heterostructures from starting materials with vastly different properties

Do you want to receive great articles like this in your mailbox? Subscribe to our newsletter.

The first in situ observation of layered metastable heterostructure formation

The first in situ observation of layered metastable heterostructure formation

Using our Wildfire system, scientists are able to thoroughly investigate the formation of heterostructures from starting materials with vastly different properties

Original article by Markus Terker, Lars Nicolai, Samuel Gaucher, Jens Herfort and Achim Trampert

Markus Terker top image in article graph

A plot showing the STEM images taken of the heterostructure demonstrating a tendency for disordered layers to order over time with annealing

Heterostructures, semiconductor structures composed of solid-state materials with different chemical properties, have found use in a variety of specialized applications where their unique characteristics are critical. The engineering of heterostructures is an important means in creating novel device concepts. In fact, it has already revolutionized the development of solar cells, transistors and even lasers. However, layering materials with vastly differing properties poses complex challenges.

Using the DENSsolutions Wildfire system, Markus Terker and his colleagues from the Paul-Drude-Institut in Berlin, Germany observe for the first time the atomic formation of a layered, metastable iron germanium crystal via two-step phase transformation. This research opens doors towards the design and formation of novel hybrid materials that combine vastly different properties, such as ferromagnets and semiconductors, and has appealing implications for optical-electronic industries.

Heterostructural interfaces and stability

Heterostructural interfaces are fundamental and versatile tools when designing electronics with varying properties, such as magnetic, optical, and transport capabilities. Since these interfaces can be used to stabilize otherwise metastable structures, understanding their structures and formation is essential to harnessing the full potential of these materials. Shedding new light on the growth of these interfaces from disordered to ordered states opens up the potential for new applications of this technology.

In this research, Terker and his colleagues observed the in situ annealing of two materials and the resulting FeGe₂ alloy interface between them. This gradual process, catalogued in the figure below, shows the crystallized FeGe₂ at the interface slowly ordering itself into layers of material.

Markus Terker figure 1 showing snap shots of annealing

In situ snapshots of the alloy interface ordering itself into periodic layers over the span of 60 minutes

From disorder to order

The starting sample consisted of a layer of Fe₃Si interfaced with amorphous germanium, a semiconductor. Heating the sample to 300 °C initiated the crystallization process and a thin layer of FeGe₂ crystal formed at the interface. This layer then grew as the sample was sustained at this temperature for the duration of an hour.

Whilst the sample was heated, in situ images were taken of the progression of the FeGe₂ crystal as it grew along the surface of the Fe₃Si base. After 15 minutes of annealing, the majority of the amorphous germanium film completely crystalized and reduced in size and disorder. However, this stage was still not completely ordered. By the 30-minute mark, the amorphous film completely crystalized and gradually ordered itself layer by layer until the entire film was in an ordered phase. 

STEM images of the (b) disordered and (c) vacancy-ordered structure of FeGe₂ observed. Atomic models of the (a) disordered and (d) ordered phase of FeGe₂ observed. The colored dots indicate the atomic stacking order.

Metastable structure

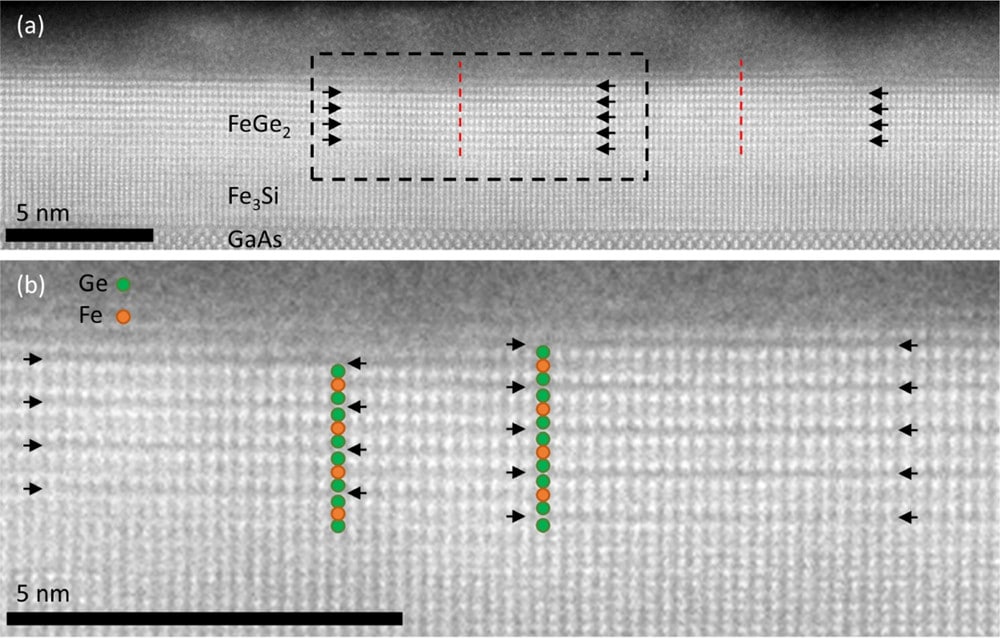
Although it was expected that pure germanium would form during this solid-phase epitaxy, the researchers observed something else entirely. A strong diffusion of iron into the germanium film was detected at relatively low crystallization temperatures. Moreover, instead of pure germanium with a diamond structure, an epitaxial film with iron content was obtained. High-angle annular dark-field (HAADF) scanning transmission electron microscopy (STEM) confirmed that the resulting crystal had a different metastable crystal structure to what was expected. The figure below shows the heterostructure produced after the annealing process. 

The heterostructure produced after the annealing process

STEM images taken of (a) the heterostructure produced after the annealing process, and (b) a magnified image of the dotted black box showing the vacant layers

Novelty in findings

Phase transformations are one of the most fascinating phenomena in nature. Observing such transformations in real time and with the resolution of individual atoms could revolutionize our understanding of their chemical and physical processes. This research demonstrates that a novel crystal phase of FeGe₂ can be interfaced from two materials with vastly different physical properties: Fe₃Si, a ferromagnet, interfaced with amorphous germanium, a semiconductor. Terker and his colleagues were able to demonstrate that a hybrid sample preparation approach can yield thin samples suitable for high resolution HAADF STEM while at the same time retaining the sample composition and structure. This approach could be applied to many different heterostructures and lead to a much broader applicability of the in situ TEM method in the study of phase transformations.

Markus personal image improved

“For the atomic scale investigation of small nanostructures at high temperatures, the reduction of sample drift is of paramount importance. The new generation of DENSsolutions Wildfire Nanochips offer the ideal solution for this due to their small and reproducible bulging. Their robustness also enables an easy and safe transfer of the specimen lamella of any form or sample geometry.”

Markus Terker
PhD Student |  Paul-Drude-Institut in Berlin, Germany 

Original article:


Discover our Wildfire solution:

Discover more publications made possible by Wildfire:

Torsten feature image

Visualizing the structural evolution of thermally-decaying platinum nanowires


Using our Wildfire system, scientists gain an exceptional in-depth understanding of the morphological changes of platinum nanowires at certain temperatures

Do you want to receive great articles like this in your mailbox? Subscribe to our newsletter.

257